Monitoring the vCenter Orchestrator Java Virtual Machine

Ever wondered how your vCenter Orchestrator is doing on memory usage ? vCenter Orchestrator Java Virtual Machine allocates a default of 2 GB Heap space.
It will consume more heap space as processes are running and will ultimately call the garbage collector to keep in memory only the used items.
If you are running a lot of workflows on your server or if you are experimenting custom workflows and plug-ins you may want to know how much of this memory is consumed. The easiest way is to download this utility.
You can copy it in $INSTALL_DIR/app-server/server/vmo/deploy/ then restart your server and check the server.log file. Every ten seconds the memory usage will be written in the log as follow:
2011-09-19 11:59:22.149+0200 INFO  [Server] JBoss (MX MicroKernel) [4.2.2.GA (build: SVNTag=JBoss_4_2_2_GA date=200710221139)] Started in 28s:819ms
2011-09-19 11:59:22.233+0200 INFO  [STDOUT] ============================ VMO server ready ==============================
2011-09-19 11:59:32.010+0200 INFO  [MEMORY_DUMP] 281.561 MB / 1.926 GB
2011-09-19 11:59:42.010+0200 INFO  [MEMORY_DUMP] 282.606 MB / 1.926 GB
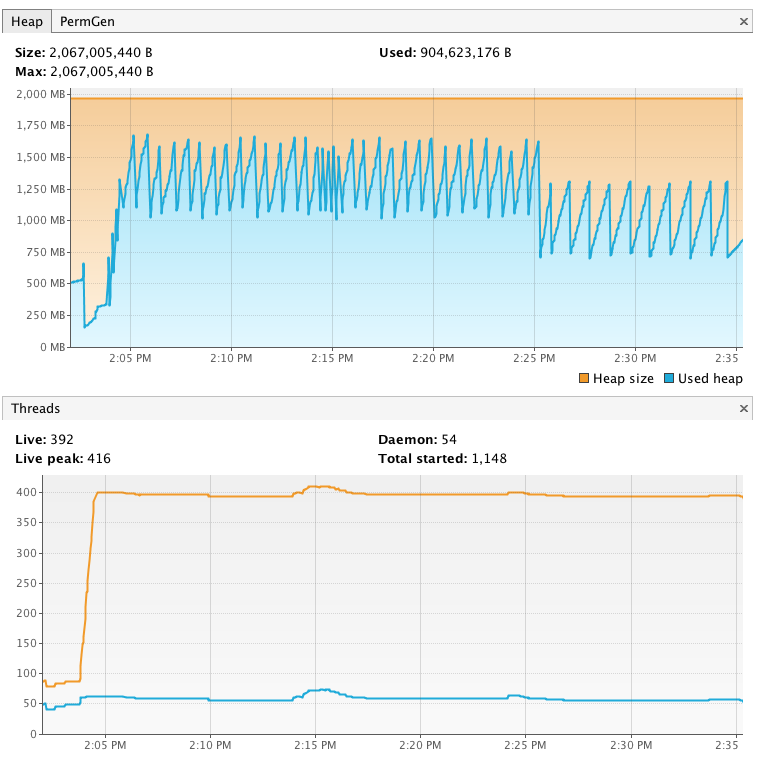
If you want to follow this real time instead of checking the logs after the facts you can download VisualVM, install it on your vCO server and run it to monitor the ch.dunes.jboss.Main. Below is a capture of vCO running hundreds or workflows in parallel.

Now if you are getting serious about this because you need to include vCenter Orchestrator in your enterprise monitoring solution you should use the Java Management Extensions (JMX). To enable JMX for a vCenter Orchestrator server started as a service:
- Create a jmxremote.password file in install_directory\app- server\server\vmo\conf. The file takes the form of a username and a password separated by a space on each line. An example is: monitor password
- Create a jmxremote.access file in install_directory\app- server\server\vmo\conf. The file takes the form of a username and a permission separated by a space on each line. An example is: monitor readonly
- Secure each of the jmxremote files on Windows as described here: http://download.oracle.com/javase/6/docs/technotes/guides/management/security-windows.html, and for non-Windows systems simply use the following command:
chmod 600 jmxremote.password jmxremote.password
Note: Essentially, each of the jmxremote files must only be accessible to the owner. Final security properties on a Windows server should show Full Access to the owner (default is Administrators group) and no other users, groups, or SYSTEM listed for access. Additionally, windows explorer will add a lock icon next to the filename.
Edit install_directory\app- server\bin\wrapper.conf by adding the lines below after line "wrapper.java.additional.9 ...":
wrapper.java.additional.10=-Dcom.sun.management.jmxremote.authenticate=true wrapper.java.additional.11=-Dcom.sun.management.jmxremote.password.file= ../server/vmo/conf/jmxremote.password wrapper.java.additional.12=-Dcom.sun.management.jmxremote.access.file=../server/vmo/conf/jmxremote.access wrapper.java.additional.13=-Dcom.sun.management.jmxremote.ssl=false wrapper.java.additional.14=-Dcom.sun.management.jmxremote.port=1099 wrapper.java.additional.15=-Djavax.management.builder.initial=org.jboss.system.server.jmx.MBeanServerBuilderImpl wrapper.java.additional.16=-Djboss.platform.mbeanserver
Note: The numbers in wrapper.java.additional.## must be in order without gap between them, otherwise wrapper ignores them. If the last property is wrapper.java.additional.10 then all above properties should be shift by 1 starting at wrapper.java.additional.11
JMX monitoring will be available after restarting the vCenter Orchestrator server.
Testing of the monitoring
JConsole is a GUI application from the Java Development Kit designed for monitoring Java applications.
The jconsole executable is in JDK_HOME/bin, where JDK_HOME is the directory where the JDK is installed. If this directory is in system path, the tool can be started by typing jconsole in a command (shell) prompt. Otherwise, it is necessary to change the current directory.
JConsole will list local processes and give the option to enter a remote one with the hostname:port syntax.
Once connected it is possible to monitor in details the memory, threads and managed beans.
The following table represents a subset of MBeans that can be used for monitoring the performance of a vCenter Orchestrator instance.
|
Workflow Execution |
|
|
Mbean |
ch.dunes.workflow.engine.mbean.WorkflowEngine |
|
Description |
Statistics about active workflows |
|
Attribute |
Description |
|
ExecutorsActiveCount |
Number of currently active workflows |
|
ExecutorsQueueSize |
Number of workflows queued |
|
Web views |
|
|
Mbean |
jboss.web:type=Cache,host=[hostname],path=/vmo |
|
Description |
webview statistics |
|
Attribute |
Description |
|
accessCount |
Number of accesses to the cache |
|
cacheMaxSize |
Max size of resources which will have their content cached |
|
cacheSize |
Max size of resources which will have their content cached |
|
desiredEntryAccessRatio |
Entry hit ratio at which an entry will never be removed from the cache. |
|
hitsCount |
Number of cache hits |
|
Apache Tomcat Global Request Processor Metrics |
|
|
Mbean |
jboss.web:type=GlobalRequestProcessor,name=http-[hostname]-[port] |
|
Description |
Apache Tomcat Global Request Processor Metrics |
|
Attribute |
Description |
|
bytesSent |
Bytes sent by all the request processors running on the Apache Tomcat container |
|
bytesReceived |
Bytes received by all the request processors running on the Apache Tomcat container |
|
processingTime |
Total processing time (in milliseconds) since startup |
|
errorCount |
Error count on all the request processors running on the Apache Tomcat container |
|
maxTime |
Maximum time it took to process a request |
|
requestCount |
Request count on all the request processors running on the Apache Tomcat container |
|
vCO web service |
|
|
Mbean |
jboss.web:type=Manager,path=/vmware-vmo-webcontrol,host=[hostname] |
|
Description |
|
|
Attribute |
Description |
|
activeSessions |
Number of currently active sessions |
|
expiredSessions |
Number of sessions that have expired |
|
maxActive |
Maximum number of sessions that have been active at the same time |
|
processingTime |
Total processing time (in milliseconds) since startup |
|
sessionAverageAliveTime |
Average time (in seconds) that expired sessions had been alive |
|
sessionCounter |
Total number of sessions created by this manager |
|
sessionMaxAliveTime |
Longest time (in seconds) that an expired session had been alive |
|
WebViewEngine |
|
|
Mbean |
jboss.web:j2eeType=Servlet,name=VSO-WebViewEngine,WebModule=//localhost/vmo,J2EEApplication=none,J2EEServer=none |
|
Description |
|
|
Attribute |
Description |
|
maxTime |
Maximum time taken (in milliseconds) for processing a request |
|
processingTime |
Total processing time (in milliseconds) since startup |
|
sessionMaxAliveTime |
The longest time (in seconds) that an expired session had been alive |
|
requestCount |
Total number of requests served since startup |
|
Web Tread pool |
|
|
Mbean |
jboss.web:type=ThreadPool,name=http-[hostname]-[port] |
|
Description |
|
|
Attribute |
Description |
|
currentThreadCount |
Number of threads created on the Apache Tomcat container |
|
currentThreadsBusy |
Number of busy threads on the Apache Tomcat container |
Possible implementation through JMX includes VMware vFabric Hyperic. It can be used to collect, store metrics from JMX and custom MBeans, and produce graphs over a long period of time.
vCenter Orchestrator has a throttling mechanism limiting the number of running workflows to 300 (default value). if additional workflows are started they will be stored in an execution queue. Even under heavy load I have never seen memory usage after garbage collecting over 1500 MB. Now this depends a lot in how the plug-ins and associated workflows were designed. In a next article I will write guidelines on how to minimize vCO resource footprint.

